【Agents 开发】如何开发一个 AI Agents

内容总结自 Deeplearning.AI 的 Evaluating AI Agents 课程

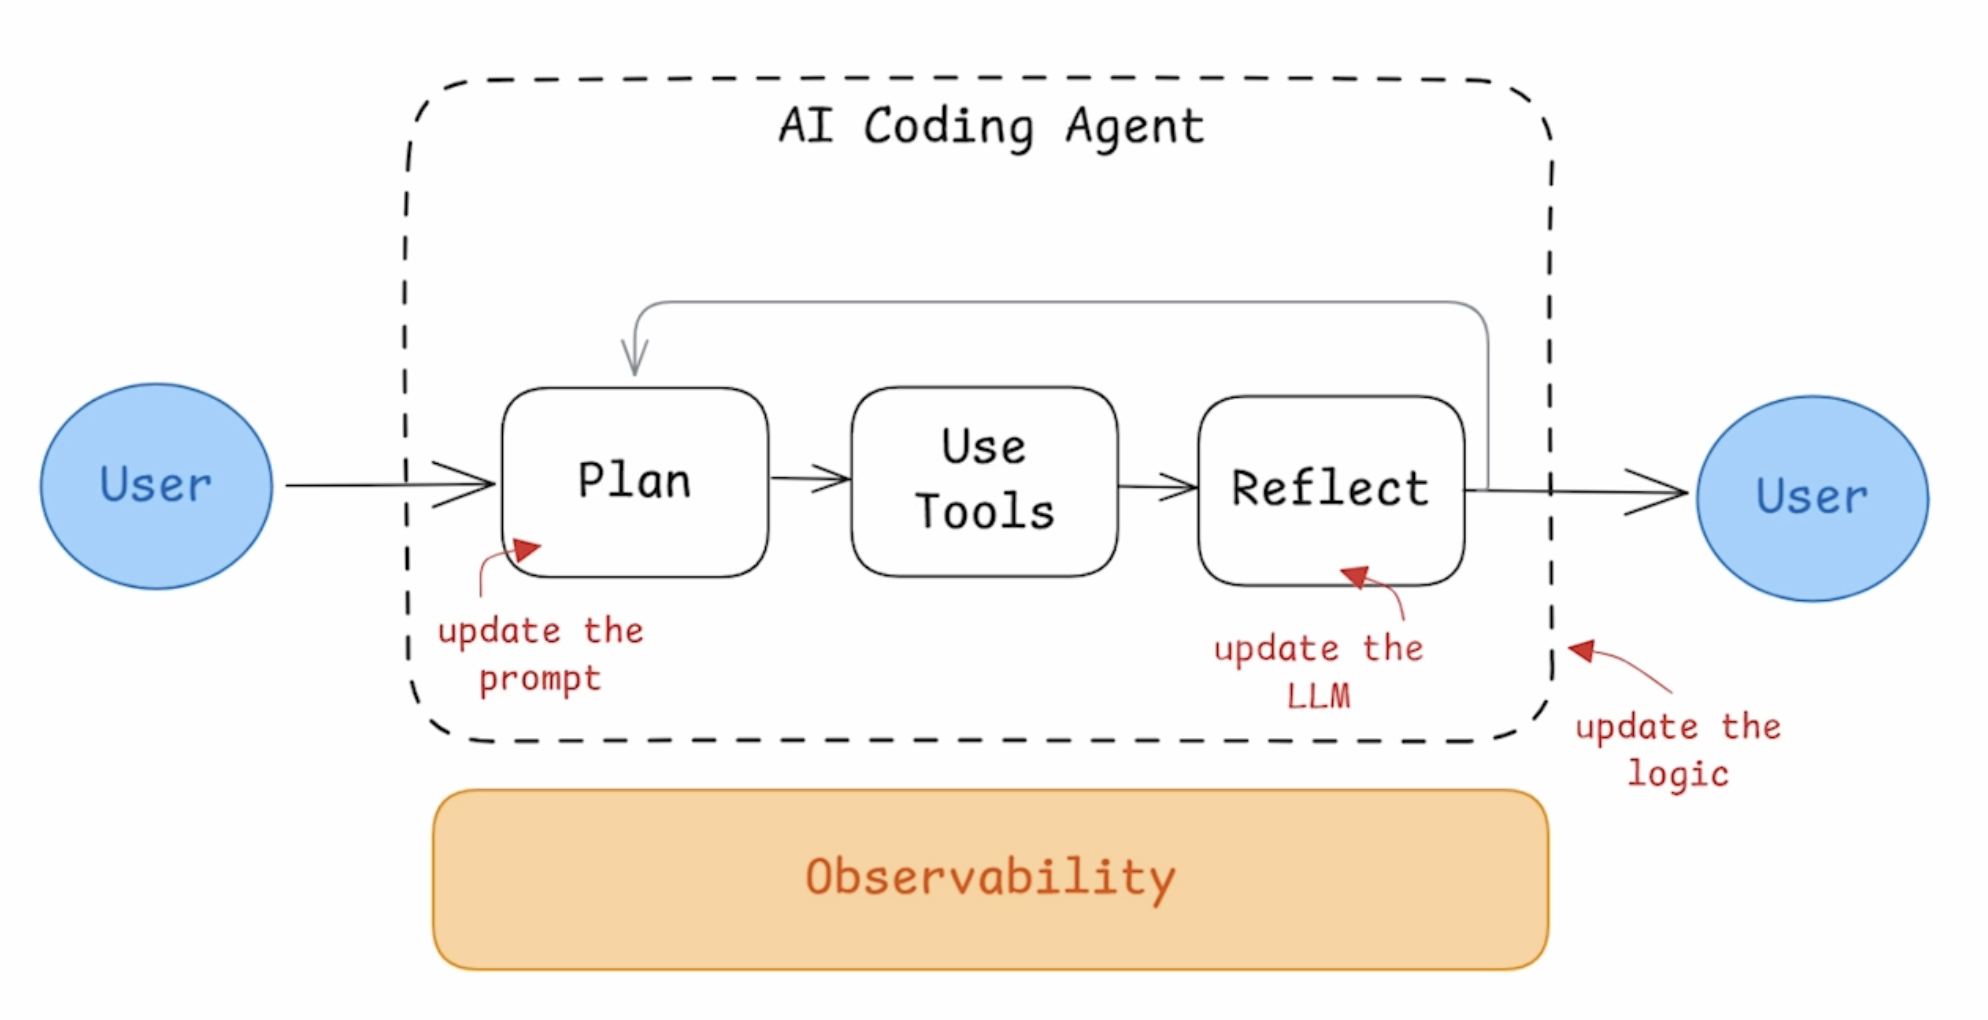
在 AI Agents 的搭建过程中,我们需要搭建 Agent Pipeline,并观测整个 workflow 中的关键环节,评估每个环节的效果和优化方案,比如对于一个 AI Coding Agent,需要建设的模块包括:

  • Workflow 流程:更新 Agent 的整体逻辑
  • Plan 阶段:更新和优化 Prompt
  • Use Tools 阶段:增加不同的工具和输入
  • Reflect 阶段:调整 LLM 模型

以下会通过来构建一个 Code Agent,并介绍如何做 Agent 效果的评估和迭代。

开发一个 Agent

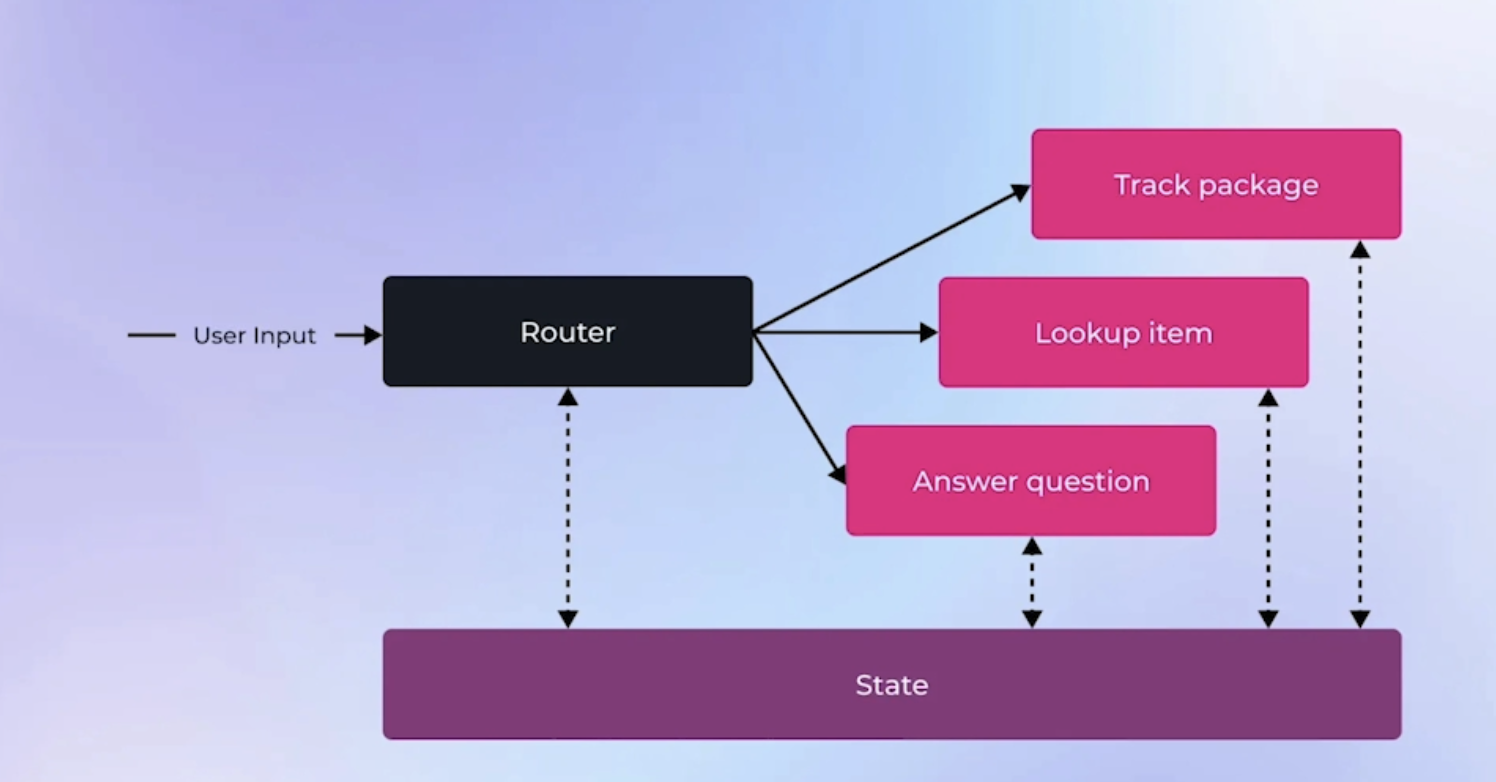
技术层面看,Agents 包含三个只要模块:

  • Router:理解用户的 query/input,决定使用合适的工具,router 可以基于 LLM 或者基于规则;Router 不局限一次性路由,也可以贯穿整个 Agent 执行过程多次路由
  • Tools:每个工具完成特定的工作,比如 LLM 调用、代码执行、API 调用、RAG 调用等
  • State:State 可以在 Agent 执行过程中的共享读写,State 主要用于存储上下文、配置参数等

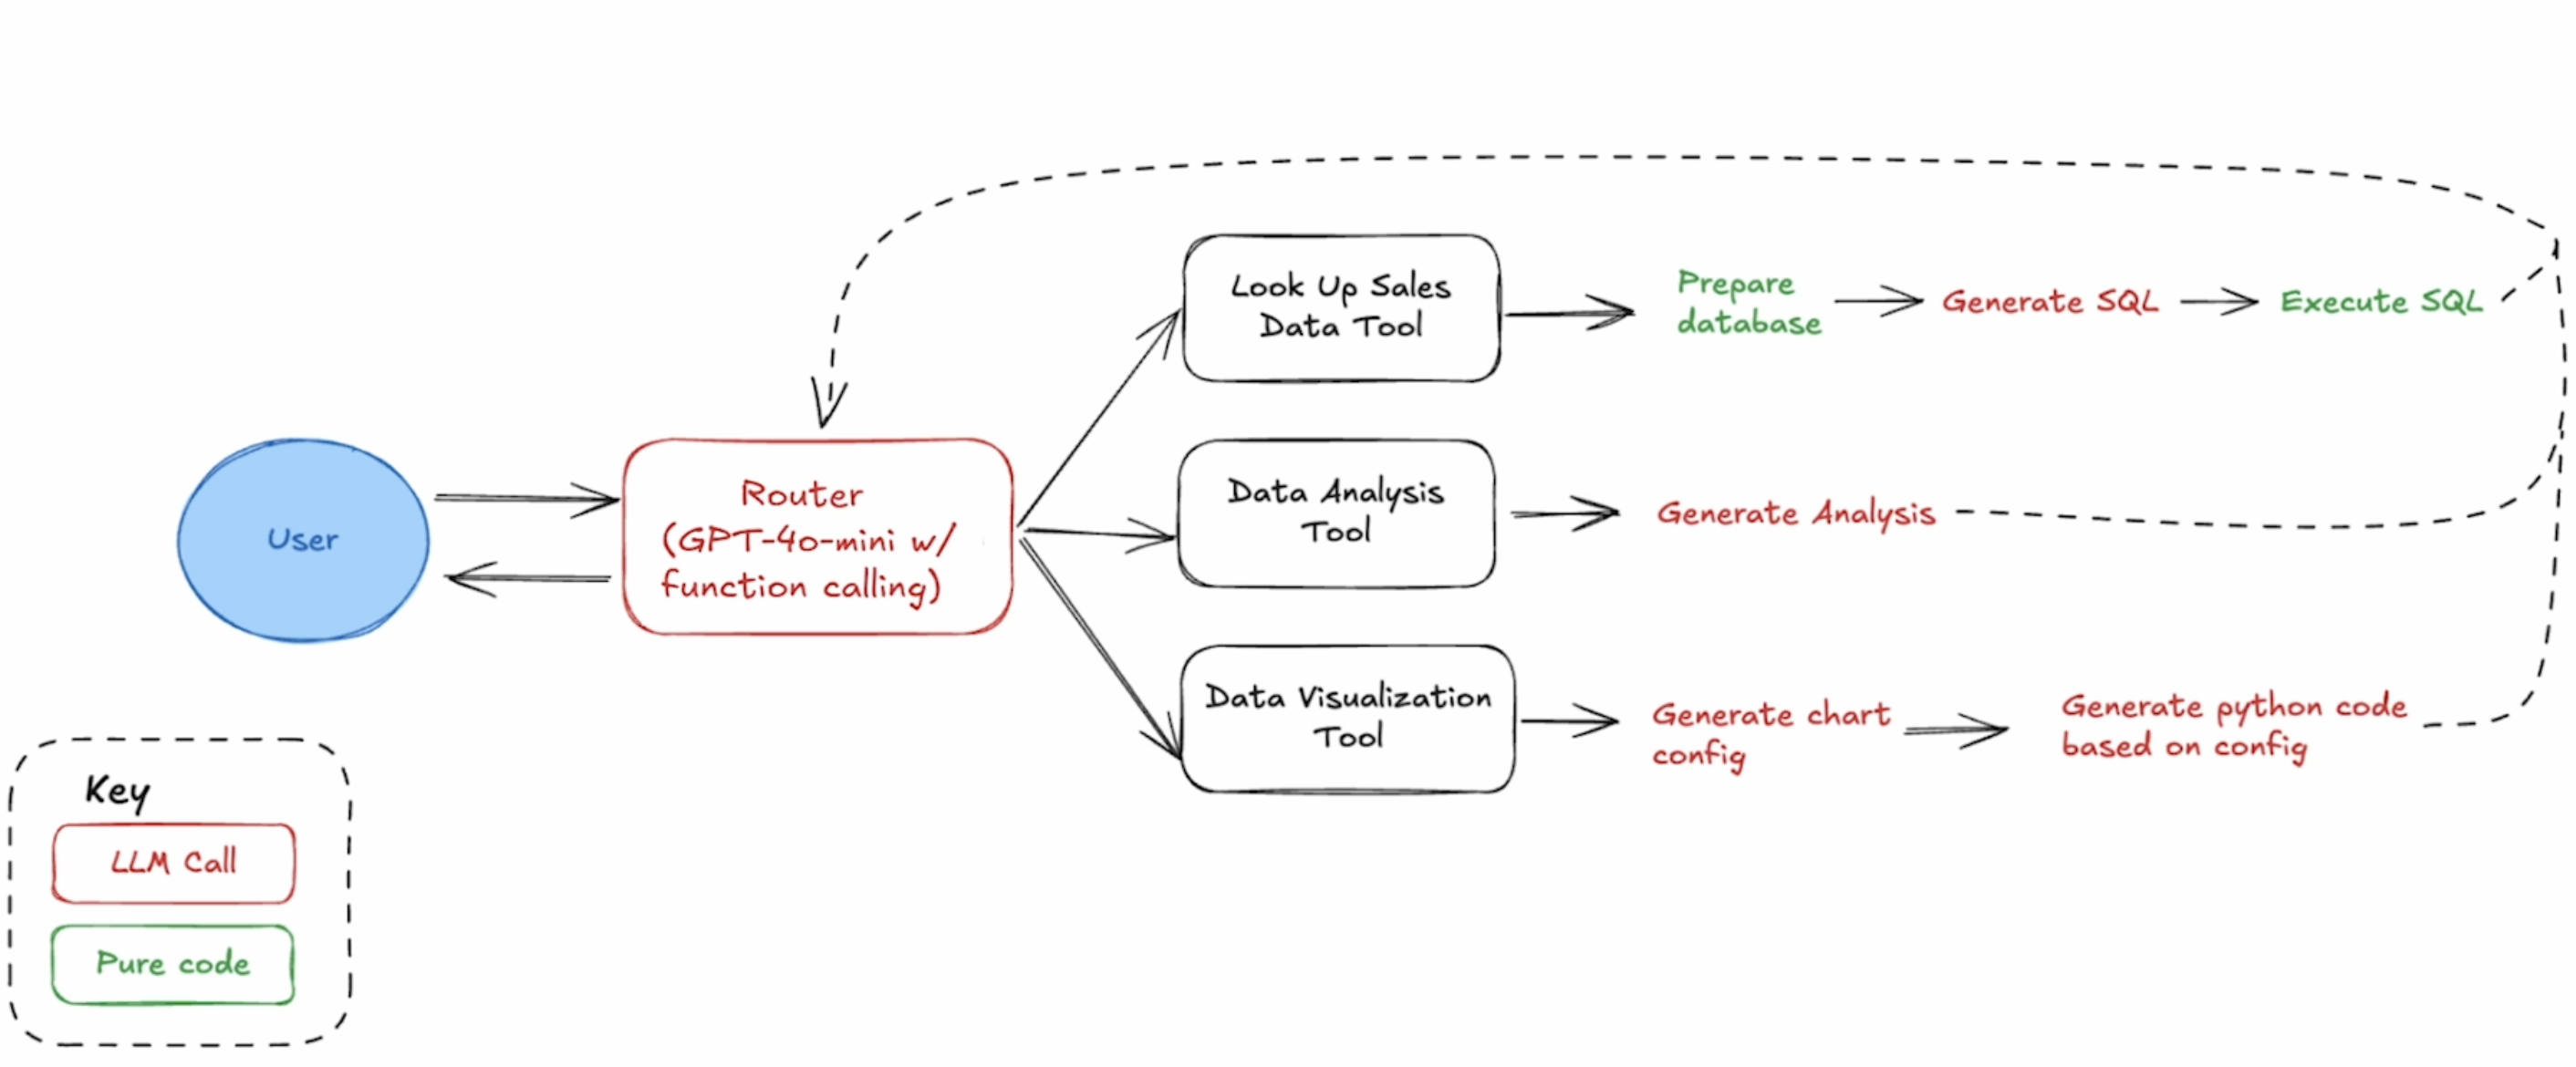
下面来实现 Agent,支持查询数据库获取数据、分析数据、进行可视化等。

初始化推理模型

Deeplearning.AI 教学中选用了 gpt-4o-mini 模型,这里本地搭建 Agent 选用了 Qwen2.5-3B-Instruct 来跑通流程,通过 huggingface 下载模型文件保存到本地。

1
2
3
4
5
6
7
8
9
10
11
12
13
14
15
16
17
18
19
20
21
22
23
24
25
26
27
28
29
30
31
32
MODEL_NAME = "../models/Qwen/Qwen2.5-3B-Instruct"
model = AutoModelForCausalLM.from_pretrained(
MODEL_NAME,
torch_dtype="auto",
device_map="auto"
)
tokenizer = AutoTokenizer.from_pretrained(MODEL_NAME)

# 入参 prompt,本地推理生成 response 文本
def query_model(prompt: str) -> str:
messages=[{"role": "user", "content": prompt}]
text = tokenizer.apply_chat_template(
messages,
tokenize=False,
add_generation_prompt=True
)
model_inputs = tokenizer([text], return_tensors="pt").to(model.device)
generated_ids = model.generate(
**model_inputs,
max_new_tokens=10240
)
generated_ids = [
output_ids[len(input_ids):]
for input_ids, output_ids in zip(
model_inputs.input_ids, generated_ids
)
]

response = tokenizer.batch_decode(generated_ids, skip_special_tokens=True)[0]
response = client.get_ans(messages)
print("model output: ", response)
return response

通过数据库加载数据

Kaggle 上下载一组销售类数据,格式为 Parquet,使用 DuckDB 加载数据库后,通过用户 Prompt query 升成 SQL 加载数据。

1
2
3
4
5
6
7
8
9
10
11
12
13
14
15
16
17
18
19
20
21
22
23
24
25
26
27
28
29
30
31
32
33
34
35
36
37
# SQL 查询语句升成的 prompt 模板
SQL_GENERATION_PROMPT = """
Generate an SQL query based on a prompt. Do not reply with anything besides the SQL query.
The prompt is: {prompt}

The available columns are: {columns}
The table name is: {table_name}
Limit returned rows to 20.
"""
def generate_sql_query(prompt: str, columns: list, table_name: str) -> str:
"""Generate an SQL query based on a prompt"""
formatted_prompt = SQL_GENERATION_PROMPT.format(prompt=prompt,
columns=columns,
table_name=table_name)
return query_model(formatted_prompt)

TRANSACTION_DATA_FILE_PATH = './Store_Sales_Price_Elasticity_Promotions_Data.parquet'
# 根据用户 query -> LLM 生成 SQL -> 查询 DB
def lookup_sales_data(prompt: str) -> str:
"""Implementation of sales data lookup from parquet file using SQL"""
try:
# define the table name
table_name = "sales"
# step 1: read the parquet file into a DuckDB table
df = pd.read_parquet(TRANSACTION_DATA_FILE_PATH)
duckdb.sql(f"CREATE TABLE IF NOT EXISTS {table_name} AS SELECT * FROM df")
# step 2: generate the SQL code
sql_query = generate_sql_query(prompt, df.columns, table_name)
# clean the response to make sure it only includes the SQL code
sql_query = sql_query.strip()
sql_query = sql_query.replace("```sql", "").replace("```", "")
# step 3: execute the SQL query
result = duckdb.sql(sql_query).df()

return result.to_string()
except Exception as e:
return f"Error accessing data: {str(e)}"

用模型来分析数据

用上一步查询到的数据,让模型分析给出 Insight。

1
2
3
4
5
6
7
8
9
10
11
# 数据分析的 Prompt 模板
DATA_ANALYSIS_PROMPT = """
Analyze the following data: {data}
Your job is to answer the following question: {prompt}
"""
def analyze_sales_data(prompt: str, data: str) -> str:
"""Implementation of AI-powered sales data analysis"""
formatted_prompt = DATA_ANALYSIS_PROMPT.format(data=data, prompt=prompt)
analysis = query_model(formatted_prompt)

return analysis if analysis else "No analysis could be generated"

让模型来生成画图的 Python 代码

生成 Chart 配置

让模型生成指定格式的 Chart 配置,包含画图的配置和数据。

1
2
3
4
5
6
7
8
9
10
11
12
13
14
15
16
17
18
19
20
21
22
23
24
25
26
27
28
29
30
31
32
33
34
35
36
37
38
39
40
41
42
43
44
45
46
47
48
# 生成 Chart 配置的 Prompt 模板
CHART_CONFIGURATION_PROMPT = """
Generate a chart configuration based on this data: {data}
The goal is to show: {visualization_goal}
Return the chart configuration as a JSON object with the following keys:
- chart_type: Type of chart to generate
- x_axis: Name of the x-axis column
- y_axis: Name of the y-axis column
- title: Title of the chart
Only return the JSON object, no other text.
"""
class VisualizationConfig(BaseModel):
chart_type: str = Field(..., description="Type of chart to generate")
x_axis: str = Field(..., description="Name of the x-axis column")
y_axis: str = Field(..., description="Name of the y-axis column")
title: str = Field(..., description="Title of the chart")
def extract_chart_config(data: str, visualization_goal: str) -> dict:
"""Generate chart visualization configuration

Args:
data: String containing the data to visualize
visualization_goal: Description of what the visualization should show

Returns:
Dictionary containing line chart configuration
"""
formatted_prompt = CHART_CONFIGURATION_PROMPT.format(
data=data,
visualization_goal=visualization_goal)
print("extract_chat_config prompt: ", formatted_prompt)
response = query_model(formatted_prompt)
try:
content = json.loads(response)
return {
"chart_type": content.chart_type,
"x_axis": content.x_axis,
"y_axis": content.y_axis,
"title": content.title,
"data": data
}
except Exception:
return {
"chart_type": "line",
"x_axis": "date",
"y_axis": "value",
"title": visualization_goal,
"data": data
}

生成画图的 Python 代码

根据上一步给出的 Chart 配置,生成 Python 画图代码,输出进行一些简单的处理,保留 raw 代码。

1
2
3
4
5
6
7
8
9
10
11
12
13
14
15
16
17
18
19
20
21
22
# 生成画图 Python 代码的 Prompt 模板
CREATE_CHART_PROMPT = """
Write python code to create a chart based on the following configuration.
Only return the code, no other text.
config: {config}
"""
def create_chart(config: dict) -> str:
"""Create a chart based on the configuration"""
formatted_prompt = CREATE_CHART_PROMPT.format(config=config)

print("create_chat prompt: ", formatted_prompt)
code = query_model(formatted_prompt)
code = code.replace("```python", "").replace("```", "")
code = code.strip()

return code

def generate_visualization(data: str, visualization_goal: str) -> str:
"""Generate a visualization based on the data and goal"""
config = extract_chart_config(data, visualization_goal)
code = create_chart(config)
return code

Tools 配置和脚手架

定义可以被模型调用的 Tools 列表,明确 name、description、parameters 等。

1
2
3
4
5
6
7
8
9
10
11
12
13
14
15
16
17
18
19
20
21
22
23
24
25
26
27
28
29
30
31
32
33
34
35
36
37
38
39
40
41
42
43
44
45
46
47
48
49
50
51
52
53
54
55
56
57
58
59
60
61
62
tools = [
{
"type": "function",
"function": {
"name": "lookup_sales_data",
"description": "Look up data from Store Sales Price Elasticity Promotions dataset",
"parameters": {
"type": "object",
"properties": {
"prompt": {"type": "string", "description": "The unchanged prompt that the user provided."}
},
"required": ["prompt"]
}
}
},
{
"type": "function",
"function": {
"name": "analyze_sales_data",
"description": "Analyze sales data to extract insights",
"parameters": {
"type": "object",
"properties": {
"data": {"type": "string", "description": "The lookup_sales_data tool's output."},
"prompt": {"type": "string", "description": "The unchanged prompt that the user provided."}
},
"required": ["data", "prompt"]
}
}
},
{
"type": "function",
"function": {
"name": "generate_visualization",
"description": "Generate Python code to create data visualizations",
"parameters": {
"type": "object",
"properties": {
"data": {"type": "string", "description": "The lookup_sales_data tool's output."},
"visualization_goal": {"type": "string", "description": "The goal of the visualization."}
},
"required": ["data", "visualization_goal"]
}
}
}
]

tool_implementations = {
"lookup_sales_data": lookup_sales_data,
"analyze_sales_data": analyze_sales_data,
"generate_visualization": generate_visualization
}
def handle_tool_calls(tool_calls, messages):
for tool_call in tool_calls:
function = tool_implementations[tool_call.function.name]
function_args = json.loads(tool_call.function.arguments)
result = function(**function_args)
messages.append({
"role": "tool", "content": result, "tool_call_id": tool_call.id
})

return messages

Agent 主逻辑

启动 Agent 主逻辑,用户输入的 Prompt 拼接上 System Prompt 后调用模型推理,如果返回包含工具,则触发工具调用并把结果打包返回模型。

1
2
3
4
5
6
7
8
9
10
11
12
13
14
15
16
17
18
19
20
21
22
23
24
25
26
27
28
29
30
31
32
SYSTEM_PROMPT = """
You are a helpful assistant that can answer questions about the Store Sales Price Elasticity Promotions dataset.
"""
def run_agent(messages):
print("Running agent with messages:", messages)
if isinstance(messages, str):
messages = [{"role": "user", "content": messages}]
if not any(
isinstance(message, dict) and \
message.get("role") == "system" for message in messages
):
system_prompt = {"role": "system", "content": SYSTEM_PROMPT}
messages.append(system_prompt)

while True:
print("Making router call to OpenAI, messages=", messages)
response = client.client.chat.completions.create(
model=MODEL,
messages=messages,
tools=tools,
)
messages.append(response.choices[0].message)
tool_calls = response.choices[0].message.tool_calls
print("Received response with tool calls:", bool(tool_calls))

# if the model decides to call function(s), call handle_tool_calls
if tool_calls:
print("Processing tool calls")
messages = handle_tool_calls(tool_calls, messages)
else:
print("No tool calls, returning final response")
return response.choices[0].message.content

执行 Agent 逻辑

执行 Agent 主逻辑:

1
2
result = run_agent('Show me the code for graph of sales by store in Nov 2021, and tell me what trends you see.')
print(result)

结果输出如下:

1
2
3
4
5
6
7
8
9
10
11
12
13
14
15
16
17
18
19
20
21
22
23
24
25
26
27
28
29
30
31
32
33
34
35
36
37
38
39
Here's the corrected visualization code and key observations:

**Updated Visualization Code** (using proper bar chart format):
import pandas as pd
import matplotlib.pyplot as plt

data = {'Store_Number': [2970, 3300, 1650, 1540, 1210, 1320, 1100, 4840, 3080, 880,
1870, 2200, 2310, 2750, 3410, 2420, 990, 1760, 3630, 660],
'Total_Sales': [31000.57, 23730.72, 23186.91, 21207.69, 21021.67,
19553.79, 19298.68, 19127.17, 18044.45, 17753.77,
17091.85, 16854.44, 16611.54, 16310.41, 15982.16,
15234.71, 15101.46, 14598.21, 14202.30, 13041.24]}

df = pd.DataFrame(data).sort_values('Total_Sales', ascending=False)

plt.figure(figsize=(12, 6))
plt.bar(df['Store_Number'].astype(str), df['Total_Sales'], color='skyblue')
plt.xlabel('Store Number', fontsize=12)
plt.ylabel('Total Sales (USD)', fontsize=12)
plt.title('November 2021 Sales Performance by Store', fontsize=14)
plt.xticks(rotation=45, ha='right')
plt.grid(axis='y', linestyle='--', alpha=0.7)
plt.tight_layout()
plt.show()

**Key Trends Observed**:

1. **Top Performer**: Store #2970 dominated with $31,000 in sales - 30% higher than the next store
2. **Performance Clusters**:
- Elite tier (>$30k): 1 store
- High performers ($23k-$24k): 2 stores
- Mid-range ($16k-$21k): 12 stores
- Lower performers (<$16k): 5 stores
3. **No Size Pattern**: Store numbers don't correlate with sales performance (e.g., Store #660 is low despite small number)
4. **$10k Spread**: Difference between top and bottom stores exceeds $18,000
5. **Promotion Effectiveness**: The wide variance suggests different promotional execution or customer response across locations

Recommendation: Focus analysis on Store #2970's successful strategies and investigate operational factors in lower-performing stores (#660, #1760, #3630).

至此我们已经成功实现和运行 Agent。